
- Jobs
 ResumeCreate your job-winning resume using our free resume builder.
 PortfolioShowcase your skills and projects with a professional portfolio.ResumeCreate your job-winning resume using our free resume builder.Resume BuilderMake a resume for free.Resume TemplatesAccess our extensive library of professional & ready-to-use templates.Resume ExamplesGet inspired by real resume examples to create your own.Occupation GuideAccess resume writing guides tailored for different professions.Resume HelpGet expert advice on all things resume from our team of recruitment specialists.
- ResourcesSuccess StoriesBusiness ExcellenceAbout CakeResumeFeatured Reads
- Hire
- Download our App


Harutyun Minasyan
Data Visualization/D3.js Developer
Senior Data Visualization developer with over 4 years of extensive experience. I have extensive knowledge in Front-End development using JavaScript/TypeScript, HTML/CSS, Angular, and advanced skills in Data Visualization (D3.js, Three.js).
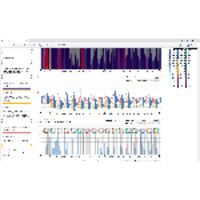
Expert in building complex Data Visualization dashboards (Text, DNA, Annotation, Network, and Time-series Data Visualization).
Akvelon, Inc
University of Tübingen
Armenia
Professional Background
- Statut ActuelEmployé
- ProfessionData Analyst・Web Developer・Software Engineer
- FieldsBig Data・Logiciel
- Expérience professionnelle4 à 6 ans (1 à 2 ans pertinente)
- ManagementNone
- Skills
- LanguagesEnglish・ProfessionnelRussian・CourantArmenian・Natif ou BilingueGerman・Intermédiaire
- Highest level of educationMaster
Job search preferences
- Desired job typeTemps plein・Intéressé par le travail à distance
- Desired positionsFull-stack Web Developmer
- Lieu de travail désiréYerevan, Armenia・United States・Germany・Canada・Dubai - United Arab Emirates
- FreelanceIndépendant à temps plein
Work Experience
Power Bi Custom Visuals Developer at Microsoft
Yerevan, Armenia
Power BI custom visuals development with d3.js, JavaScript/TypeScript.
Data Visualization D3.js (Part Time)
Visualization Research;
Implementation of application with D3.js
Product Researcher / Data Visualization D3.js (Part Time)
Product Research;
Visualization Research;
Implementation of visualization with D3.js;
Data Visualization D3.js
Force-directed graph visualization for LinkedIn data, the purpose of the tool is to discover
potential clients.
Visualization Research;
Implementation of the Front-End part of the application with D3.js
Front-End development (part time)
Front-End development
Used languages and technologies: JavaScript, SAPUI5, HTML/CSS
Front-End And Data Visualization Developer (part time)
Visualization Research
Implementation of the Front-End part of the application with D3.js
Co-writer of a scientific paper named “AnnoXplorer: A Scalable, Integrated Approach for the Visual Analysis of Text Annotations”
Used languages and technologies: JavaScript, D3.js, HTML/CSS
Front-End Developer (Intern Student)
Front-End implementation of a project named “LUI 2.0– LDAP User Interface for Identity & Access
Management”
Used languages and technologies: JavaScript/TypeScript, HTML/CSS, Angular, Bootstrap, PrimeNG
Education

Bachelor of Science (BS)
・
Bachelor's degree in Informatics
Master of Science (MS)
・
Master's degree in Telecommunication Engineering .
Master of Science (MS)
・
Master's degree in TelecommunicationBachelor of Science (BS)
・
Radio engineering and Communications.