- Jobs
 ResumeCreate your job-winning resume using our free resume builder.
 PortfolioShowcase your skills and projects with a professional portfolio.ResumeCreate your job-winning resume using our free resume builder.Resume BuilderMake a resume for free.Resume TemplatesAccess our extensive library of professional & ready-to-use templates.Resume ExamplesGet inspired by real resume examples to create your own.Occupation GuideAccess resume writing guides tailored for different professions.Resume HelpGet expert advice on all things resume from our team of recruitment specialists.
- ResourcesSuccess StoriesBusiness ExcellenceAbout CakeResumeFeatured Reads
- Hire
- Download our App


Covid19 dash board

Covid19 dash board
Data analysts / Bioinformatics / NGS
・
Yokohama, Kanagawa, Japan
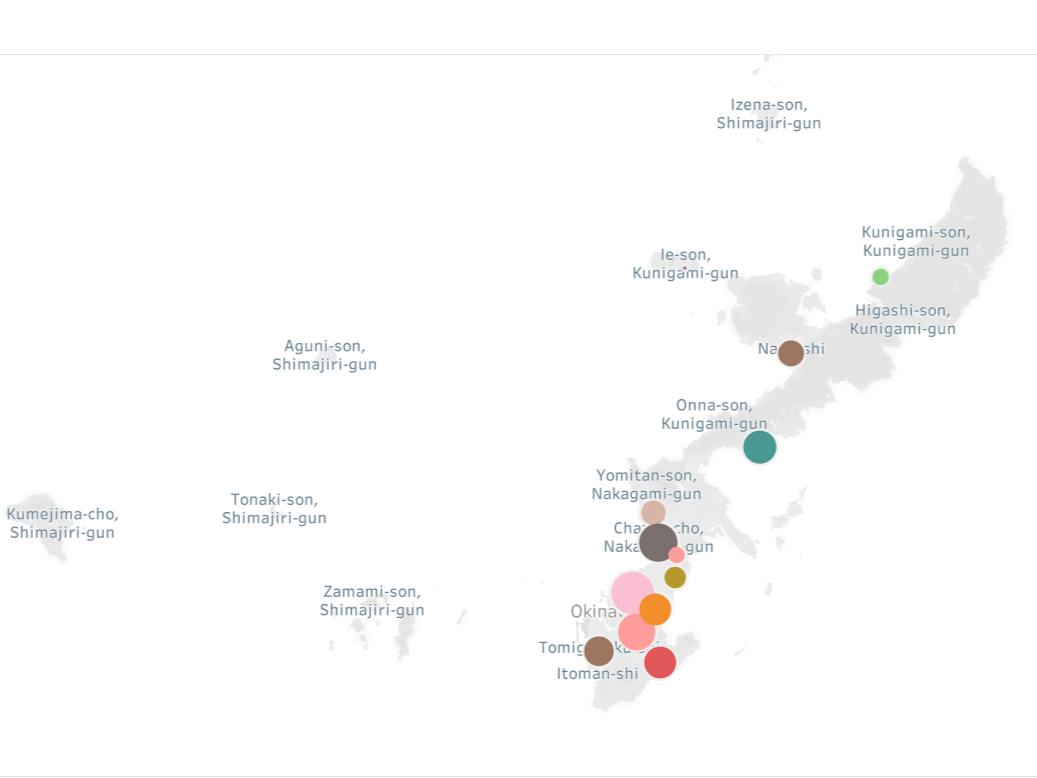
Covid 19 pandemic dash board
- The data was first downloaded from Data source and saved into csv file.
- The downloaded csv files then were imported into Azure SQL EDGE with the import wizard.
- All data cleaning steps were performed by SQL.
- The cleaned SQL tables then were output into Excel files and visualized by Tableau.
- I ran the Azure SQL edge on Mac by docker.
- The IDE is Azure Data Studio.

The world is becoming more and more open for traveling. With the high percentage of infected population, high fully-vaccinated rate as well as the low death rate, EU may be the best place for tourists to go around. To help people have the idea about pandemic situation, I create a dash board by SQL and Tableau.
Please login to comment.